


Images Courtesy: Wikimedia Commons
What is cartography? Simply put, it is the science and practice of drawing maps. We humans have long tried to depict the Earth’s three-dimensional features on a two-dimensional, flat surface. Interestingly, maps have a language of their own: symbols, directions, scale, and detail. Over time, maps served different purposes, hence, they evolved from pictorial or artistic renditions to the more accurate, digital, scalable versions today.
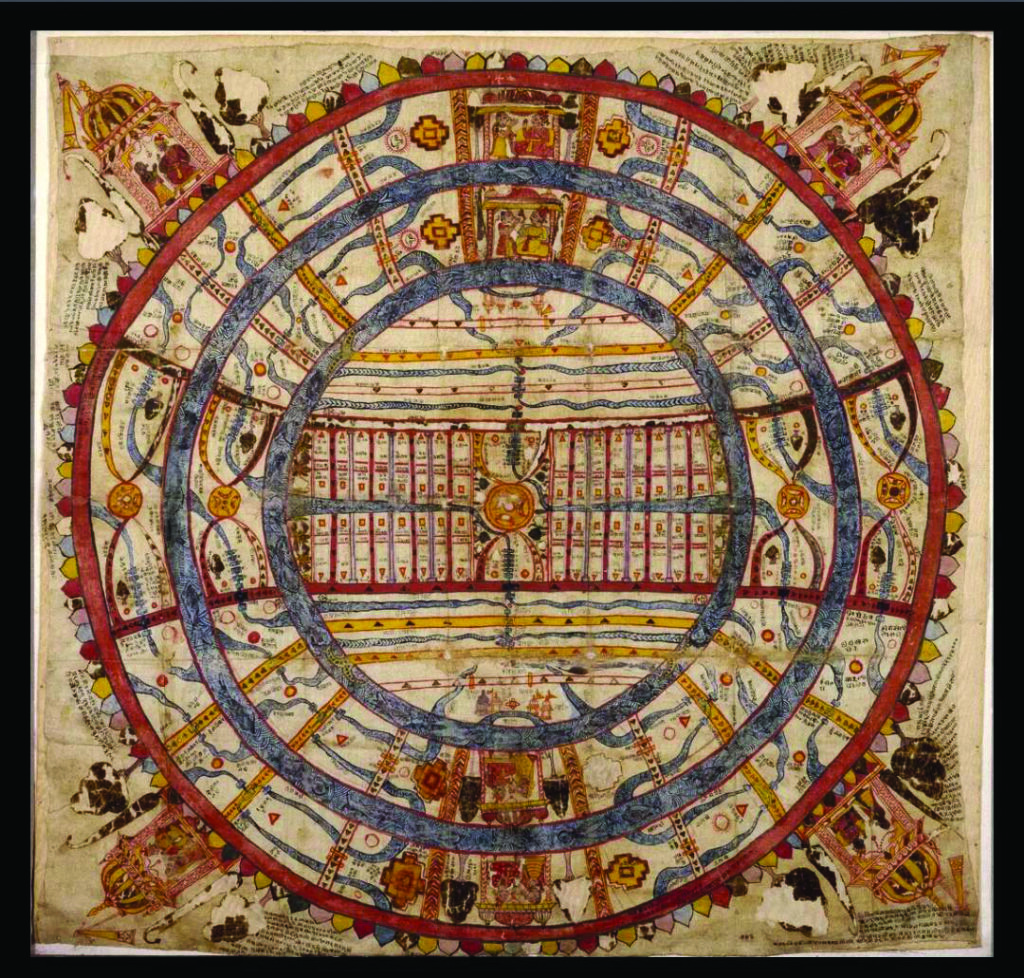
Long before the introduction of the modern surveyor’s chain and theodolite, cartography in the Indian subcontinent existed as a vibrant synthesis of cosmology, pilgrimage, and administrative geography. Early Indian maps were rarely constructed on rigid, mathematical grids; instead, they were topological. Rather than absolute coordinates, they focused on conveying a sense of place, highlighting the relationships between sacred sites, pilgrimage and commercial routes, and human movement. Whether through the coastal piloting charts used by Gujarati mariners or the revenue-assessment maps under the Mughal Empire, space was traditionally understood through political jurisdiction and human experience.
Colonial rule shifted Indian cartography from cultural documents to mathematical tools, as the British demanded precise territorial measurement and scientific quantification.
THE ORIGINS OF CARTOGRAPHY IN INDIA
The ancient and medieval foundations of Indian cartography were conceptual and interwoven with religion and cosmology. In ancient Indian thought, the cosmos was represented through sacred geometry. Central to this was the concept of Jambudvipa (the land of the rose apple tree), where the known world was mapped as a series of concentric islands and ring-shaped oceans radiating outward from Mount Meru (active stratovolcano located in Tanzania, East Africa.). Next came the Pilgrimage Maps or Tirtha Patas. These scroll paintings functioned as spiritual guides rather than navigational tools. Designed for pilgrims, the physical size of a site or temple was dictated entirely by its religious significance. Distances shrank or expanded based on the spiritual intensity of the journey. The Mughal administrative mapping in the medieval period brought a distinct shift toward practical utility. The most prominent example is the Ain-i-Akbari (the administration of Emperor Akbar, 16th century), which meticulously recorded land holdings, provincial boundaries, and distances. It transformed the map from a spiritual canvas into an essential instrument for revenue assessment and governance.
The historical span from the Indus Valley Civilization, 3300 BCE, to the arrival of Vasco da Gama in 1498 CE presents a compelling paradox. Given the Indian subcontinent’s massive historical contributions, the scarcity of surviving ancient maps is deeply surprising, especially when compared to contemporary records found elsewhere.
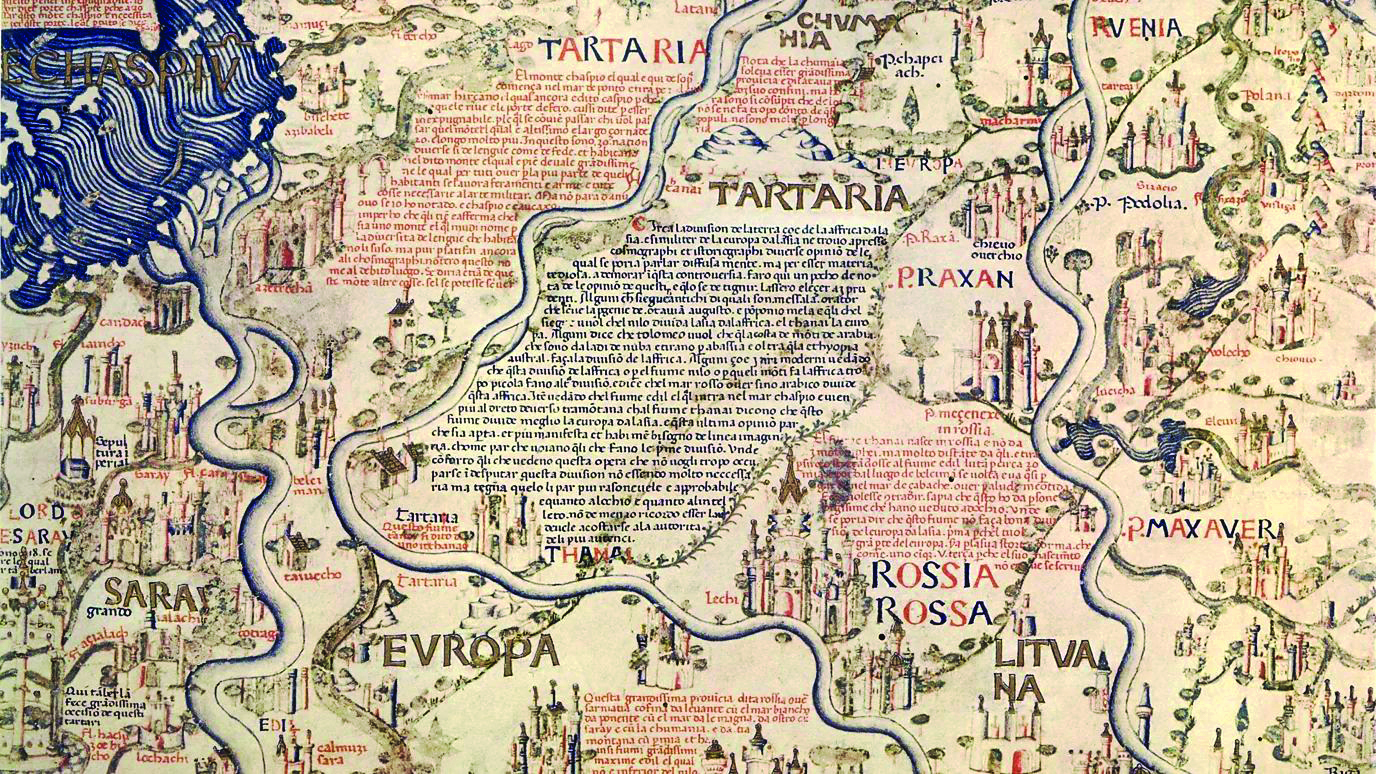
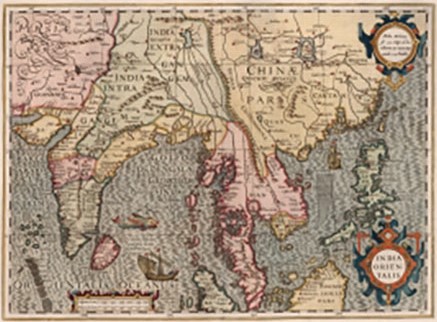
While indigenous physical maps from the Middle Ages are rare, the Indian subcontinent was frequently charted by outsiders; some of these attempts are described as following. The Greco-Roman Ptolemy famously shrank the Indian peninsula, vastly exaggerated Sri Lanka, and mistakenly drew the Indian Ocean as a landlocked sea. The Iranian and Arab geographers brought mathematical precision, aligning their maps’ prime meridian directly with Ujjain. Persian polymath Abu Rayhan Biruni, early 11th century, travelled extensively to map western Indian cities with distance tracking and documented the region’s geology. By 1154, Arab geographer Muhammad al-Idrisi integrated a detailed section of Indian geography into his landmark world atlas called The Tabula Rogeriana. Italian scholar Francesco Lorenzo Pullè preserved India’s spatial heritage by reproducing rare, historic regional maps from ancient Kashmiri and Jain cosmological manuscripts.
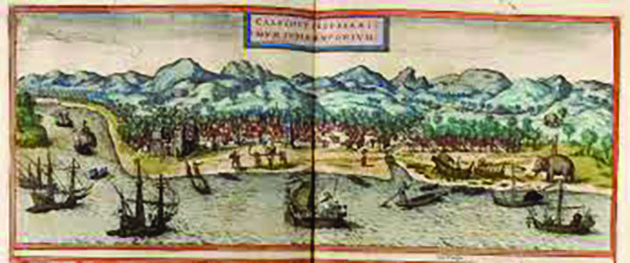
Following Vasco da Gama’s arrival in 1498, European efforts to map the Indian coastline accelerated rapidly, producing highly coveted maritime charts like the Portuguese Cantino Planisphere of 1502. This period quickly evolved into a vibrant cartographic melting pot, blending European breakthroughs with indigenous advancements. Within the subcontinent, Mughal innovation flourished through Sadiq Isfahani’s unique and south-oriented world atlas and the masterful use of seamless, hollow casting by metallurgists to construct precise metallic globes.
With the rise of the British Raj, cartography shifted from an illustrative art into a disciplined, mathematical tool of statecraft. Control over India required precise boundaries. In 1767, the British Survey of India set the stage for The Great Trigonometrical Survey.
Mapping of independent India started in 1947, with the newly formed Indian government recognizing that mapping was no longer just about establishing borders, it was vital for economic growth, infrastructure, and identifying natural resources. The government established the Central Board of Geophysics (CBG) in 1949, focusing on the country’s Terrestrial Front and Marine Front. Today, modern mapping is maintained by the Survey of India (SOI) alongside the National Atlas and Thematic Mapping Organisation (NATMO).
THE NEW ERA OF SCIENTIFIC CARTOGRAPHY
The dawn of scientific mapping in India was marked by a shift from descriptive charts to mathematical geodesy. Geodesy is the science of accurately measuring and understanding the Earth’s geometric shape, orientation in space, and gravity field. The East India Company established the Survey of India, recognizing that the traditional maritime navigation and qualitative land surveys were insufficient for building railways, assessing land revenues, and moving military units efficiently. This new era demanded a unified framework that could account for the curvature of the Earth over a vast, continental landmass. Maps were no longer merely illustrations; they became precise mathematical projections capable of guiding engineering, military strategy, and administrative policy.
THE GREAT TRIGONOMETRICAL SURVEY AND THE ROLE OF RADHANATH SIKDAR
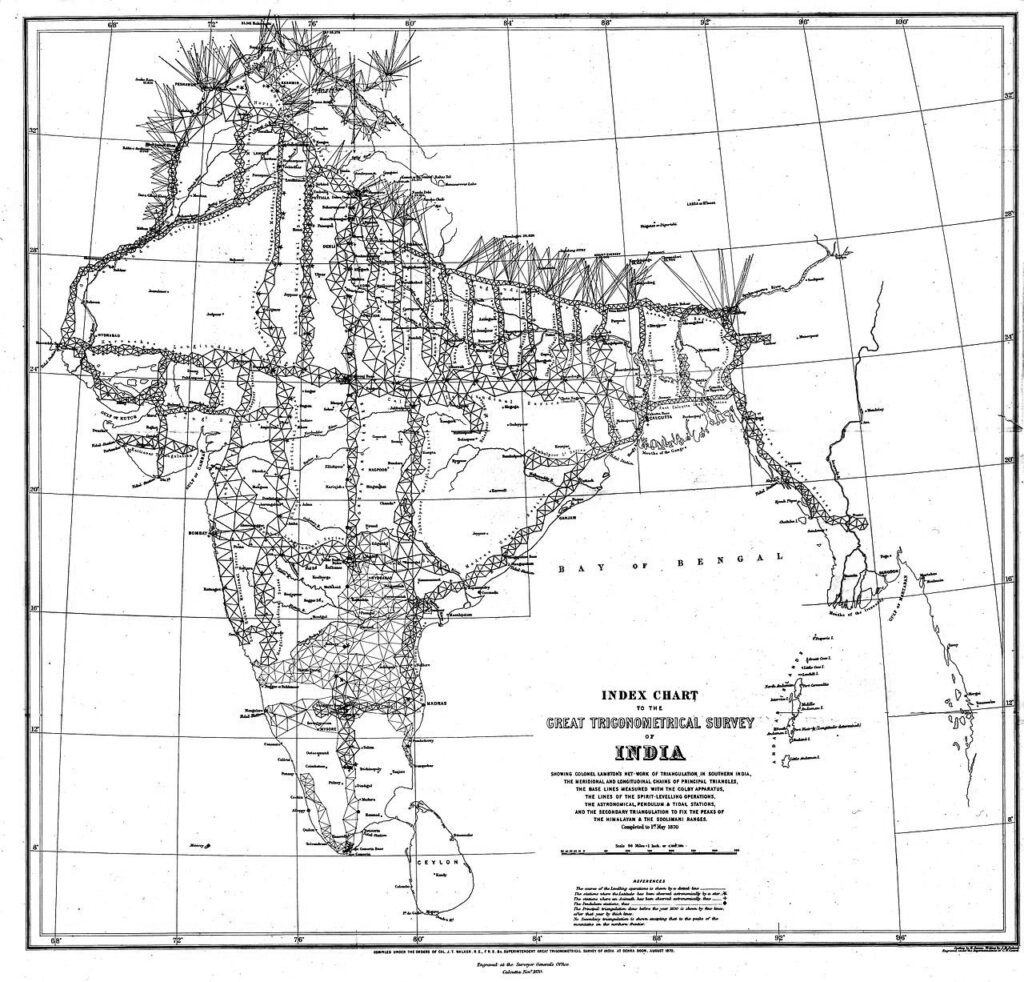
Begun in 1800 after the war with Tipu Sultan of Mysore, the Great Indian Arc of the Meridian was the longest surface measurement ever attempted. Capt. Lambton planned a geographical survey across the conquered territory, throwing triangles from Madras to the opposite coast to find the peninsula’s breadth. This inch-perfect, 1,600-mile task took courageous teams nearly fifty years to complete.
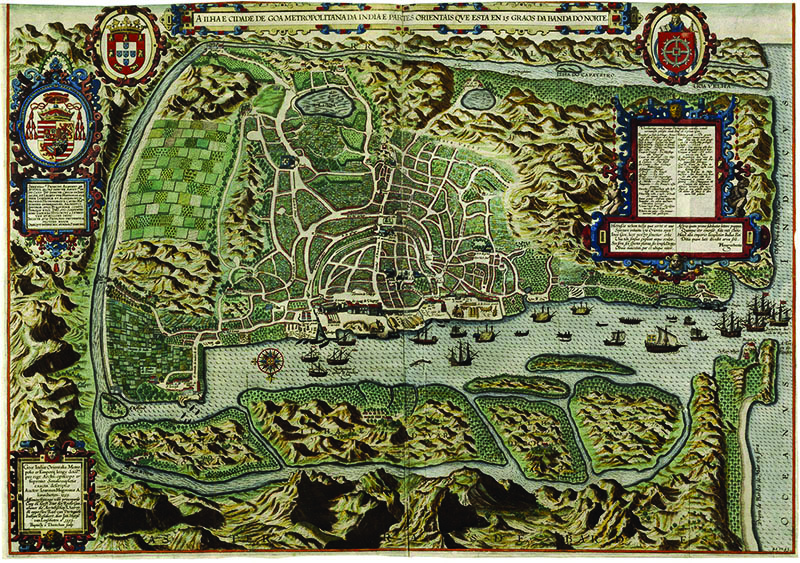
Image Courtesy: Wikimedia Commons
Whilst these operations were being carried out, an order was on its way to England for a supply of instruments of the best manufacture that could be obtained. One of such instruments received from England was a 36-inch theodolite, which is a precision optical instrument used primarily in land surveying and construction to accurately measure horizontal and vertical angles. On the 10th of April, 1802, the Great Trigonometrical Survey of India commenced. Between the years 1802 and 1815, a network of triangles was, under the superintendence of Colonel Lambton, carried over the whole country as high as 18° latitude, whereby the peninsula was completed from Goa on the west to Masulipatam on the east, with all the interior country from Cape Comorin (now called Kanniyakumari) to the southern boundaries of the Nizam’s and Maratha territories.
On 1 January 1818, Colonel Everest was appointed and first acted on a longitudinal series of the great triangles emanating from the Beder base line towards Bombay. By the end of 1832 a longitudinal series of triangles had been completed from Seronj in Central India to Calcutta in Bengal.
While still working on mapping Calcutta, Everest had begun his search for a mathematician. John Tytler, a professor of Mathematics at the Presidency College, Calcutta, recommended his 18-year-old student, Radhanath Sikdar. Sikdar secured the job at the GTS on 19 December 1831 as a ‘computer’ at a salary of thirty rupees per month. Sikdar’s job was to carry geodetic surveys—the study of the earth’s geometric shape orientation in space and gravitational field. George Everest retired in 1843 and was succeeded by Colonel Andrew Scott Waugh. Eight years later, in 1851, Sikdar was promoted to the position of Chief Computer and transferred to Calcutta.
At the order of Colonel Waugh, Sikdar started measuring the height of mountains. In 1852, he discovered that Kangchenjunga, which was considered to be the tallest in the world, wasn’t really so. In 1849, an initial reading of Himalayan ranges was taken by James Nicolson who estimated that there might be a higher peak, Peak XV. Sikdar built upon the readings from his location 800 km away, paying particular attention to Peak XV. He arrived at a definitive calculation of the summit’s height. The calculation of Sikdar placed the height of Mount Everest about 29000 ft but this round figure was looking at an approximate variable. So, he added 29002 ft to give it a more accurate and effective number. This remained the height of Mount Everest till an Indian survey re-calculated it to be 29,029 ft or 8848 m in 1955. Waugh officially announced this finding in March 1856, and named Peak XV in honour of his predecessor, Mount Everest and conveniently forgot Sikdar.
Technological advancements, data from thousands of climbers, and the discovery of different routes to the summit all have led to a more accurate calculation of the height of Mount Everest—a peak that grows at the rate of 4 mm every year and whose summit is slowly moving northeastwards each passing year.
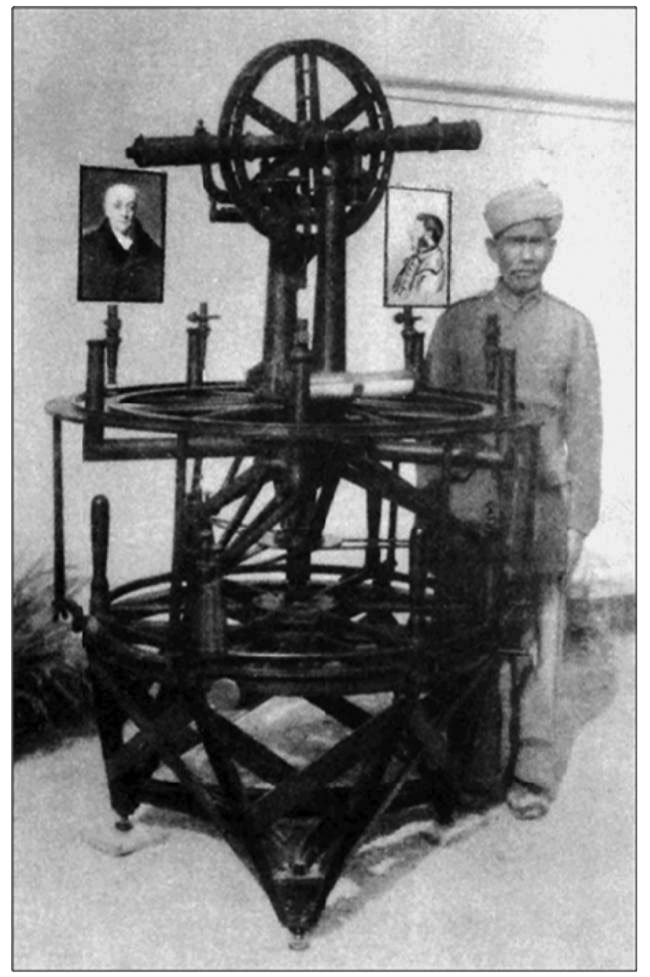
Image Courtesy: Wikimedia Commons
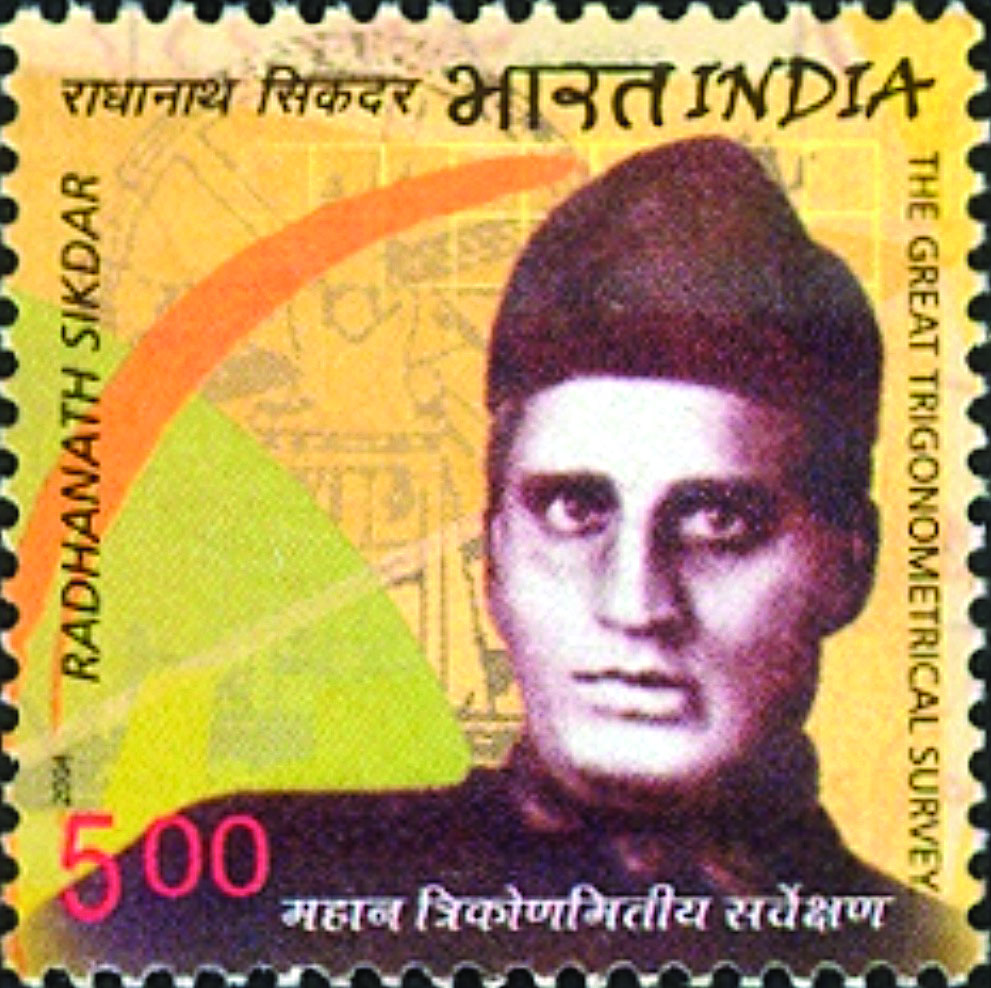
By December 1841, the whole Indian arc from Cape Comorin to the Himalayas, forming the main axis of Indian geography, was finally completed. The area covered by the great arc operations aggregated 56,997 square miles. In 2004, India Post issued a commemorative stamp to honour the greatest contributors to the Survey and acknowledged Radhanath Sikdar’s work.
APPLICATIONS OF MAPS
1. The Strategic and Imperial Use of Maps (19th Century): The British Empire used detailed scientific maps which served three main purposes: they helped move troops safely through mountains and rivers to defend the borders, they allowed the British to accurately tax farmers based on their land size.
2. Post-Independence–Modernization & Self-Reliance: After Independence in 1947, the Survey of India took full control of mapping for national defence and development. It created highly detailed, color-coded topo-sheets and updated the geographical measuring system based on mean sea level data from Mumbai and Chennai, perfectly aligning major infrastructure projects to modern global standards.
Images Courtesy: Wikimedia Commons
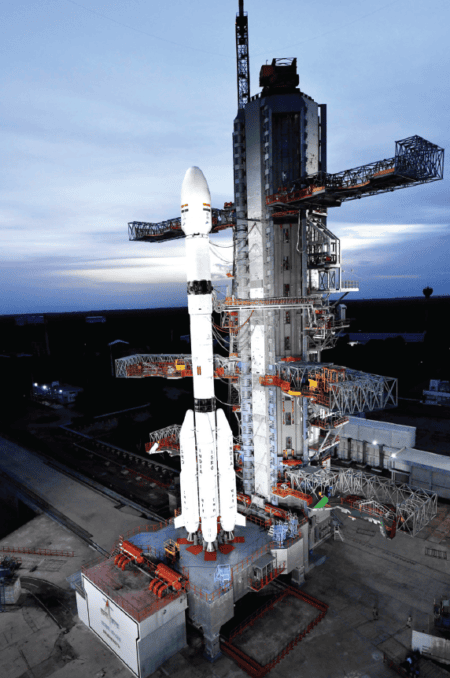
3. ISRO and Remote Sensing: ISRO’s remote sensing satellite series, launched from 1988 onwards, transformed Indian agriculture, deforestation monitoring, and disaster management. The subsequent Cartosat series introduced high-resolution panchromatic imagery to build precise Digital Elevation Models (DEMs), advancing urban planning and defence. Complementing these satellite networks, the 2009 Bhuvan portal provides comprehensive 2D and 3D geospatial visualizations across the Indian subcontinent.
4. Digital Frontier: GIS, NavIC, and Open Data: India’s private geospatial ecosystem is booming. NavIC provides independent regional satellite navigation across the country and its borders, integrating directly into commercial smartphones. Following a historic 2021 data deregulation, domestic firms now freely collect high-precision mapping data to fuel logistics innovation. Today world-class digital archives provide deep insights into India’s spatial past. The David Rumsey Map Collection hosts over 110,000 historical maps, while Google’s Cosmology to Cartography tracks the visual history of Indian maps. Additionally, the University of Michigan’s online exhibit features a brilliant public-domain collection of early European and Mughal maps.
5. IoT Integration and Real-Time Geovisualization- The transition to live mapping is among the biggest advances. Modern maps feed real-time data to track traffic patterns and public transportation systems by integrating Geographic Information Systems (GIS) with the Internet of Things (IoT). Urban areas can function as smart cities thanks to this infrastructure, which optimizes energy distribution and dynamically manages resources depending on environmental sensors and foot traffic. With the use of artificial intelligence (AI), cloud computing, and real-time streaming, modern cartography has transformed from static representations into dynamic, data-driven ecosystems.
6. Artificial Intelligence and Predictive Modelling: Automated data extraction from high-resolution satellite imagery and Light Detection and Range (LiDAR) data has been made possible by the integration of AI and machine learning (GeoAI). In order to anticipate urban sprawl, spot early indicators of illicit deforestation, or detect sudden changes in land cover, AI algorithms continuously scan geographic layers. These predictive maps are used in disaster management to plan quick, automated emergency responses and resource distribution by simulating climate risks, modelling the spread of wildfires, or mapping storm surges.
7. Environmental Sustainability and Green Cartography: In order to monitor the advancement of global sustainability metrics, like the Sustainable Development Goals of the United Nations, modern mapping is essential. Researchers can localize macro-level climate data down to municipal boundaries using multiscale cartography. Additionally, the developing field of ‘green cartography’ places a high priority on algorithmic and computational efficiency, guaranteeing that processing large spatial datasets reduces data centers’ carbon footprint.
8. Spatial Immersive Technologies: Two-dimensional cartography has evolved into 3D and 4D (time-series) visualizations. Precise asset placement, elevation changes, and physical structures are all captured by high-fidelity digital twins of urban areas. When combined with mixed reality (MR) and augmented reality (AR), these developments make it possible for features like indoor navigation with improved visibility, which enables emergency personnel, architects, and city planners to simulate structural variables and see underground utilities with remarkable clarity.
9. Democratized Mapping and Hyper-Local Services: Communities are able to close important data gaps thanks to the democratization of cartographic software through crowdsourced platforms like OpenStreetMap and open-source tools like QGIS. Simultaneously, consumer mobile applications are powered by hyper-local location-based services (LBS), which facilitate accurate e-commerce logistics, hyper-targeted marketing, and customized route planning.
10. Structural and Lithological Mapping: In the mining, resource extraction, and exploration sectors, cartography is the most important tool for locating valuable ores and minerals. It is referred to as Mineral Potential Mapping (MPM). This advanced area of cartography is used by exploration companies to create a three-dimensional visual guide of the earth’s crust by layering data from the air, space, and deep underground. Geologists produce intricate lithological maps (which display different types of rocks) and structural maps (which display faults, folds, and fractures) prior to starting any drilling. The majority of significant mineral deposits, such as gold, copper, or iron ore, were created along old geological faults where superheated fluids or magma pushed their way through the crust. Cartographers can identify areas where minerals are most likely to have accumulated by tracing historical crustal stresses using structural lines, or lineaments.
11. Epidemiological and Public Health Mapping- Cartography is perhaps the most crucial in the study of disease tracking, modelling, and prevention; epidemiological maps overlay health data on demographic and environmental maps to highlight patterns that would not be visible on a standard map. Public health agencies are able to map real-time data of disease cases, such as malaria, influenza, or dengue, to determine where the disease hotspots are and then deploy medical resources, vaccines, or containment measures where needed most.
When scientists overlay disease clusters with environmental factors, such as water bodies, temperature zones, air pollution metrics, or population density, they are able to trace the environmental determinants of health. Cartography can be applied to examine spatial gaps in healthcare delivery by mapping the travel times of patients to hospitals or clinics. This application actually dates back to 1854, when Dr John Snow famously mapped cholera cases in Soho, London. By marking each death as a point on a street map, he visually demonstrated that the cases clustered around a specific public water pump on Broad Street, effectively founding modern epidemiology through cartography.
CARTOGRAPHY: FROM PAST TO FUTURE
Indian cartography has reflected the political and cultural changes, from its origins in topological pilgrimage scrolls and sacred cosmology to the rigorous mathematical geodesy of the British rule. In the modern era, cartography transitioned from paper maps to a dynamic, digital frontier. Modern Indian cartography, driven by ISRO satellites, GeoAI, and real-time IoT integration, is an essential tool for public health, urban planning, and national defence, demonstrating that mapping is essential to comprehending both our past and our future.
*The writer is a Lecturer of Chemistry at Central Institute of Petrochemicals Engineering & Technology (CIPET): CSTS, Bhopal. Having a PhD in Chemistry alongside dual Master’s degrees in Chemistry and Biotechnology, she has over a decade of experience in higher education. Her research focuses on Supramolecular and Bio-Organic chemistry.